Econometrics I
TA Christian Alemán
Session 1: Friday 21, January 2022
Activity 1: Simulations
Simulate a Normal Distribution:

% Housekeeping
clear all
close all
clc
% Begin Script
rng(1234)                 % Set seed for reproductivity
%
par.N = 500;              % Number of observations
var.x_vec = NaN(par.N,3); % Initialize random variable
par.sigma = [0.1,1,2];    % Standard Deviation \sigma
par.mu    = [0,0,0];      % Mean  \mu

% This loop simulates the random variable
for i = 1:3
   var.x_vec(:,i) =  par.mu(i) + par.sigma(i).*randn(par.N,1);
end
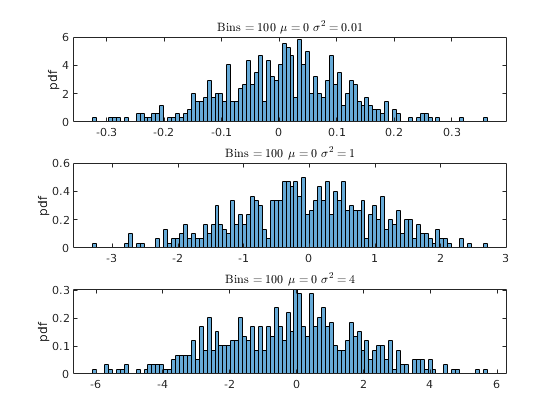
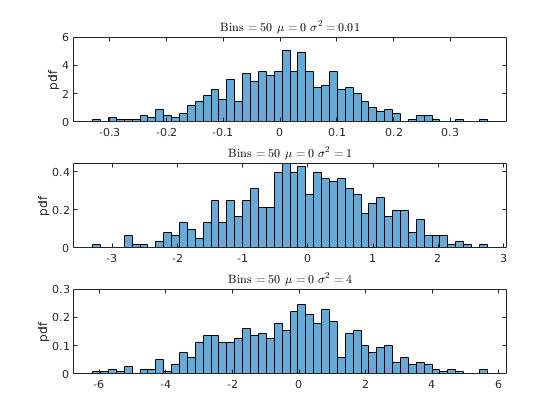
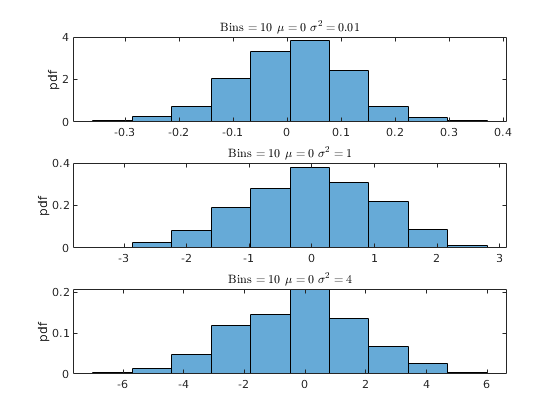
% Generate a density histogram
par.num_bins = [100,50,10];         % Number of Bins
opt.norm_type = {'count','pdf'};    % Normalization type
opt.sel_norm  = 2;                  % 1: count 2: pdf
for j = 1:3
    for i = 1:3
       figure(j)
       subplot(3,1,i)
       histogram(var.x_vec(:,i),par.num_bins(j),'Normalization',opt.norm_type{opt.sel_norm})
       ylabel([opt.norm_type{opt.sel_norm}])
       title(['Bins $ = \,$',num2str(par.num_bins(j)),' $\mu=\,$',num2str(par.mu(i)),' $\sigma^{2}=\, $',num2str(par.sigma(i)^(2))],'interpreter','latex')

    end
end
Activity 2: Kernel Density (Estimation)
Histogram:
![$f^{hist}(x)= \frac{1}{N}\sum^{N}_{i=1}\frac{1}{b} \textbf{1}_{x_{i}\in[x-0.5b,x+0.5b]}$](s1_eq09990872769297376882.png)
Where  is the bin width
Kernel:

Where  is the bin width
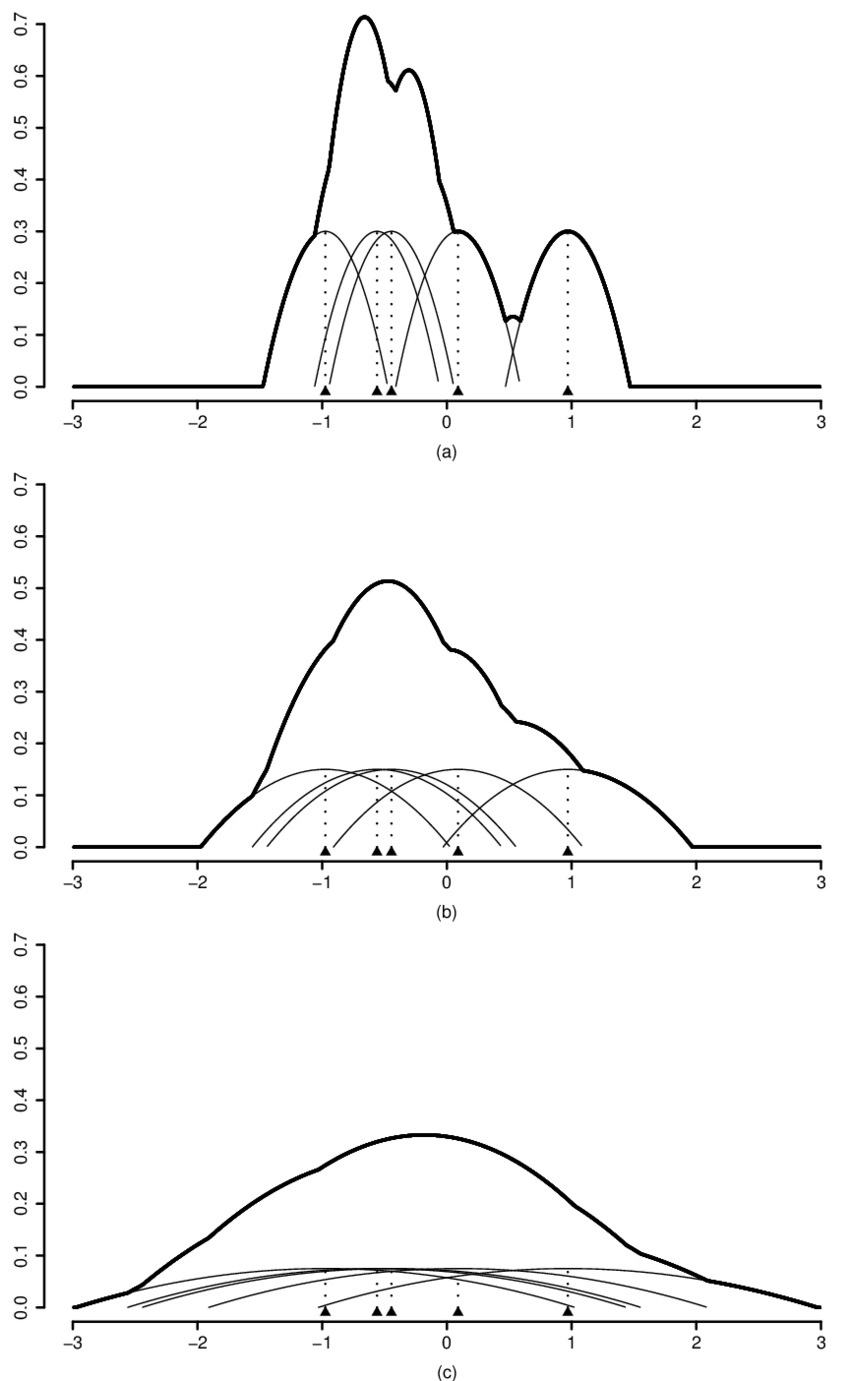
And  is the Kernel function. The most common types are:
- Normal
- Box
- Triangle
- Epanechnikov
Figure: Kernel Types
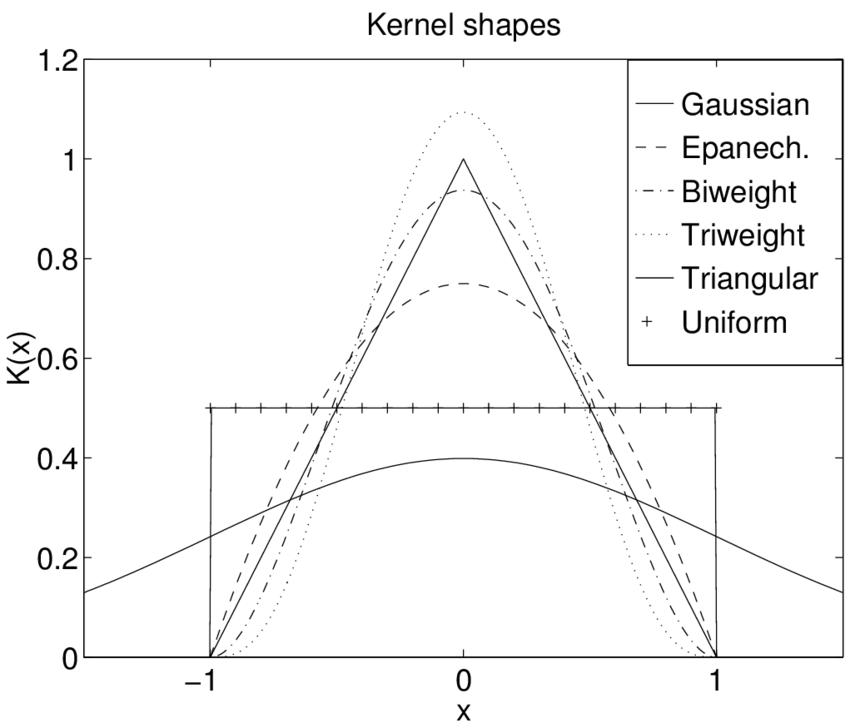
Figure: Kernel Illustration
Practical Example
% Pick one simulation:
par.N = 300; %5000;                                           % Number of observations
var.x_vec = par.mu(2) + par.sigma(2).*randn(par.N,1);         % Simulate again

% Kernel Parameters
par.bw = [NaN,1.8,3];                                           % BandWidth
opt.kfunc = {'normal', 'box','triangle','epanechnikov'};        % Kernel Functions
var.kdensity = NaN(100,3);                                      % Initialize Kernel Density
par.support  = NaN(100,3);                                      % Initialize Kernel Support
par.ahk_support = linspace(-4,4,100)';                           % Ad Hock Support

% Construct Kernel Density
for i = 1:3
    if i==1
        [var.kdensity(:,i),par.support(:,i),dbw] = ksdensity(var.x_vec,'Kernel',opt.kfunc{1});
        par.bw(i) = dbw; % Save default Bandwith
    else
        [var.kdensity(:,i),par.support(:,i),dbw] = ksdensity(var.x_vec,'Kernel',opt.kfunc{1},'Bandwidth',par.bw(i));
    end
end

% Obtain theoretical PDF of the normal
var.true_density = normpdf(par.ahk_support,par.mu(2),par.sigma(2));


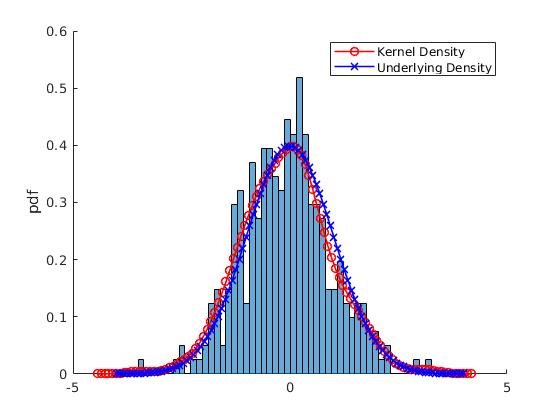
figure(4)
hold on
histogram(var.x_vec,par.num_bins(2),'Normalization',opt.norm_type{opt.sel_norm});
p2 = plot(par.support(:,1),var.kdensity(:,1),'r-o','linewidth',1.2);
p3 = plot(par.ahk_support,var.true_density,'b-x','linewidth',1.2);
legend([p2 p3],{'Kernel Density','Underlying Density'})
ylabel(opt.norm_type{opt.sel_norm})

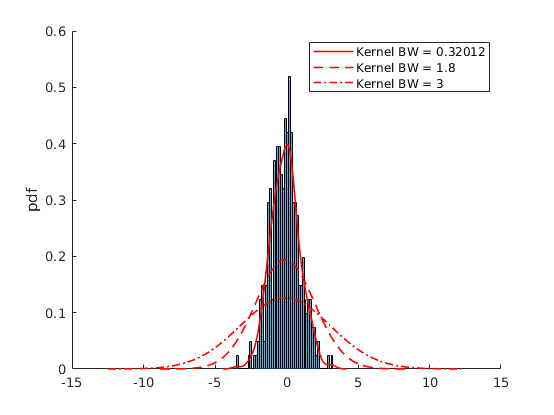
figure(5)
hold on
histogram(var.x_vec,par.num_bins(2),'Normalization',opt.norm_type{opt.sel_norm});
p2 = plot(par.support(:,1),var.kdensity(:,1),'r-','linewidth',1.2);
p3 = plot(par.support(:,2),var.kdensity(:,2),'r--','linewidth',1.2);
p4 = plot(par.support(:,3),var.kdensity(:,3),'r-.','linewidth',1.2);
ylabel(opt.norm_type{opt.sel_norm})
legend([p2,p3,p4],{['Kernel BW = ',num2str(par.bw(1))],['Kernel BW = ',num2str(par.bw(2))],['Kernel BW = ',num2str(par.bw(3))]})
Simulate Data form any distribution
The inverse CDF method

Where F is the CDF of the desired distribution and u are draws from 
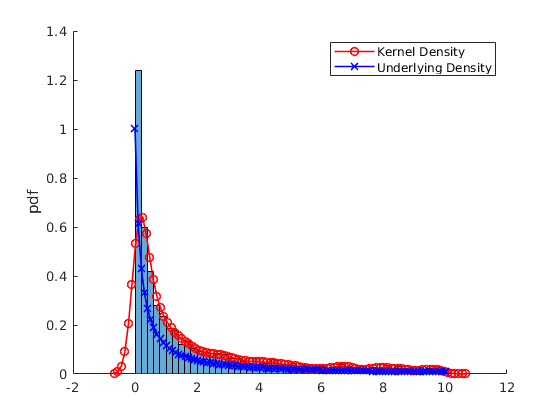
Repeat the above example for the Generalized Pareto distribution
par.N = 5000; %5000;                                           % Number of observations
opt.correction = 0;                                            % Reflection correction
par.sigma = 1;
par.k = 5;
par.theta = 0;
%var.x_vec = gprnd(par.k,par.sigma,par.theta,par.N,1);        % Simulate Using Matlab Inbuilt
var.x_vec = sim_gp(par.N,par.k,par.sigma,par.theta);          % Simulate using own function
I = var.x_vec>10;
var.x_vec = var.x_vec(not(I));
par.N = size(var.x_vec,1);


% Kernel Parameters
par.bw = [NaN,1.8,3];                                           % BandWidth
opt.kfunc = {'normal', 'box','triangle','epanechnikov'};        % Kernel Functions
var.kdensity = NaN(100,3);                                      % Initialize Kernel Density
par.support  = NaN(100,3);                                      % Initialize Kernel Support
par.ahk_support = linspace(0,10,100)';                          % Ad Hock Support

% Construct Kernel Density
for i = 1:3
    if i==1
        if opt.correction ==0
            [var.kdensity(:,i),par.support(:,i),dbw] = ksdensity(var.x_vec,'Kernel',opt.kfunc{1});
        else
            [var.kdensity(:,i),par.support(:,i),dbw] = ksdensity(var.x_vec,'Kernel',opt.kfunc{1},'Support',[0,Inf],'BoundaryCorrection','reflection');
        end
        par.bw(i) = dbw; % Save default Bandwith
    else
        if opt.correction ==0
            [var.kdensity(:,i),par.support(:,i),dbw] = ksdensity(var.x_vec,'Kernel',opt.kfunc{1},'Bandwidth',par.bw(i));
        else
            [var.kdensity(:,i),par.support(:,i),dbw] = ksdensity(var.x_vec,'Kernel',opt.kfunc{1},'Bandwidth',par.bw(i),'Support',[0,Inf],'BoundaryCorrection','reflection');
        end
    end
end

% Obtain theoretical PDF of the normal
var.true_density = gppdf(par.ahk_support,par.k,par.sigma,par.theta);

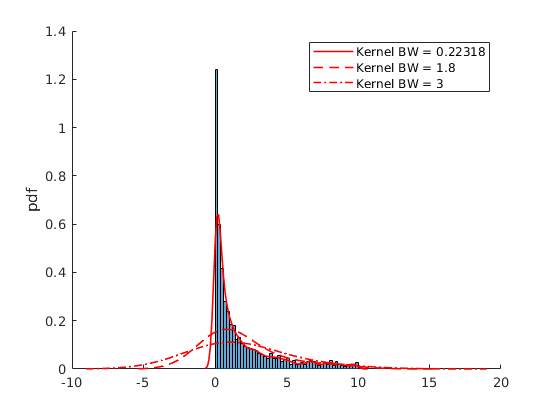
figure(6)
hold on
histogram(var.x_vec,par.num_bins(2),'Normalization',opt.norm_type{opt.sel_norm});
p2 = plot(par.support(:,1),var.kdensity(:,1),'r-o','linewidth',1.2);
p3 = plot(par.ahk_support,var.true_density,'b-x','linewidth',1.2);
legend([p2 p3],{'Kernel Density','Underlying Density'})
ylabel(opt.norm_type{opt.sel_norm})

figure(7)
hold on
histogram(var.x_vec,par.num_bins(2),'Normalization',opt.norm_type{opt.sel_norm});
p2 = plot(par.support(:,1),var.kdensity(:,1),'r-','linewidth',1.2);
p3 = plot(par.support(:,2),var.kdensity(:,2),'r--','linewidth',1.2);
p4 = plot(par.support(:,3),var.kdensity(:,3),'r-.','linewidth',1.2);
ylabel(opt.norm_type{opt.sel_norm})
legend([p2,p3,p4],{['Kernel BW = ',num2str(par.bw(1))],['Kernel BW = ',num2str(par.bw(2))],['Kernel BW = ',num2str(par.bw(3))]})
Activity 3: Spourious relations

rng(4567)                 % Set seed for reproductivity

% Generate x_{1},x_{2},x_{3}
par.N        = 100;
par.x2_mu    = 3;    %    % Mean
par.x2_sigma = 1;         % Standard Deviation
par.eps_sigma1 = 0.1;     % Standard Deviation Error 1
par.eps_sigma2 = 0.3;     % Standard Deviation Error 2
par.beta_0   = 4;
par.beta_1   = 0.3;
par.alpha_0  = -1;
par.alpha_1  = 2;


var.x2_vec = par.x2_mu + par.x2_sigma.*randn(par.N,1);
var.eps_1 = par.eps_sigma1.*randn(par.N,1);
var.eps_2 = par.eps_sigma2.*randn(par.N,1);
var.x1_vec = par.beta_0 + par.beta_1.*var.x2_vec+var.eps_1;
var.x3_vec = par.alpha_0 + par.alpha_1.*var.x2_vec+var.eps_2;

opt.v_names = {'rho(x_{1},x_{2})','rho(x_{3},x_{2})','rho(x_{1},x_{3})'};
c_table = array2table([corr(var.x1_vec,var.x2_vec),corr(var.x3_vec,var.x2_vec),corr(var.x1_vec,var.x3_vec)],'VariableNames',opt.v_names)


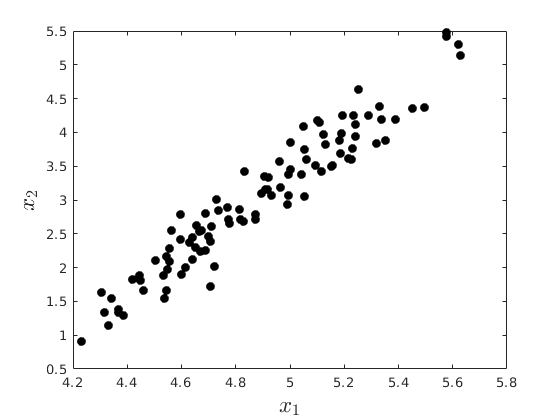
figure(8)
plot(var.x1_vec,var.x2_vec,'ko','MarkerFaceColor','k')
xlabel('$x_{1}$','fontsize',17,'interpreter','latex')
ylabel('$x_{2}$','fontsize',17,'interpreter','latex')

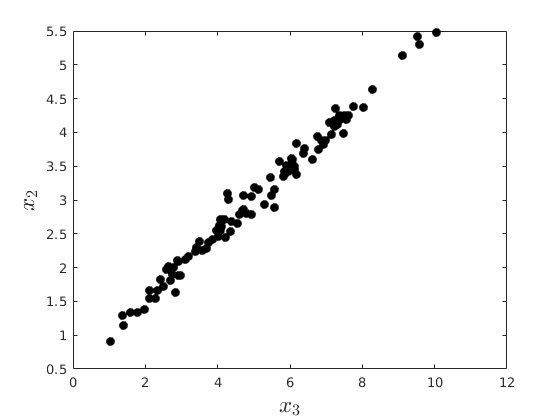
figure(9)
plot(var.x3_vec,var.x2_vec,'ko','MarkerFaceColor','k')
xlabel('$x_{3}$','fontsize',17,'interpreter','latex')
ylabel('$x_{2}$','fontsize',17,'interpreter','latex')

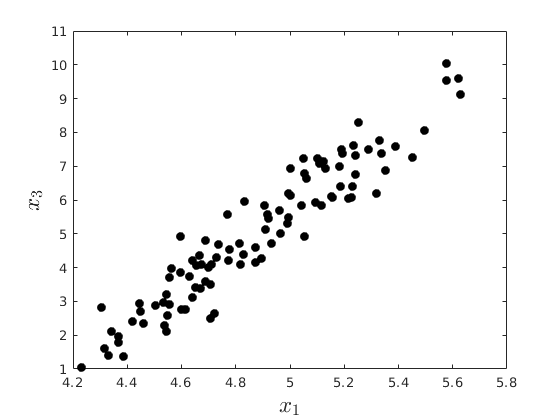
figure(10)
plot(var.x1_vec,var.x3_vec,'ko','MarkerFaceColor','k')
xlabel('$x_{1}$','fontsize',17,'interpreter','latex')
ylabel('$x_{3}$','fontsize',17,'interpreter','latex')
c_table =

  1×3 table

    rho(x_{1},x_{2})    rho(x_{3},x_{2})    rho(x_{1},x_{3})
    ________________    ________________    ________________

        0.95992             0.99146             0.94858
% Create the simulator function:
function data = sim_gp(N,k,sigma,theta)
% This function simulates a vector data for the generalized Pareto using the inverse
% CDF method:
%{

Inputs:
    N     : Number of observations to be simulated
    k     : Index Shape
    sigma : Scale
    theta : Threshold location

Output:
    data  : NX1 vector of data
%}
var_x = rand(N,1);
data = sigma./k.*((1-var_x).^(-k)-1)+theta;
end